0
Needs & Resource
Assessment
February 2023
Prepared by
ISI Consulting

1
Message from the Executive Director
Marcia L. Nash
Executive Director
Aiken County First Steps
“There is immense power when a group of people with similar
interest gets together to work toward the same goal.”
I cannot express enough thanks to the Aiken County First Steps board, staff
and community agencies for their support in completing the needs and
resource assessment. You are valuable in advancing our mission of getting
children healthy and ready for school and your expertise will drive us to
expand outreach, enhance our programs, and deepen our impact for the
benefit of children and families in Aiken County.
-Marcia L. Nash

2
Executive Summary
The Aiken County First Steps responded to the needs of the families and organizations working
“collaboratively to ensure that all children start school ready to reach their highest potential with engaged
support from their parents, caregivers, and communities.” The Needs and Resource Assessment was
created to serve as a key reference document for Aiken County First Steps, and other partners
implementing data-driven changes to promote school readiness.
The project described was supported through South Carolina First Steps by the Preschool Development
Grant Birth through Five Initiative (PDG B-5), Grant Number 90TP0080-02-01 from the Office of Child Care,
Administration for Children and Families, U.S. Department of Health and Human Services. It is our hope
that the findings from this Needs and Resource Assessment will assist leadership in identifying windows
of opportunity and stewarding resources.
Both quantitative and qualitative data were collected as part of this two-month process from January to
February 2023. Detailed analysis of well-being indicators (income and poverty, education, overall-
wellbeing, health, teen childbearing, child maltreatment, adverse childhood experiences, affordable
housing, and food environment) provide insight into trends occurring over the last seven to ten years. In
addition, a focus group with four mothers was conducted and four interviews were conducted by phone
with educators and content experts to identify root causes of issues that have been identified.
The complexity and nuance of issues surrounding kindergarten readiness and disparities in educational,
developmental and health outcomes for children, require systems-thinking and a comprehensive and
collaborative approach. Twenty-one individuals met on February 21, 2023 to review the Needs
Assessment and determine priorities.
The priorities that emerged from this Needs Assessment include:
• Increase outreach to focused areas and communities (Indicator: Number of individuals reached
and type of outreach).
• Increase capacity building of parents, grandparents, and caregivers (Indicator: Number of classes
and number of caregivers reached).
• Ensure quality and accessible childcare (interaction, supervision and health and safety)
(Indicator: Assessment results from individual childcares, number of quality and accessible
childcare options and number of childcare vouchers).
• Promote overall health and health screenings (Indicator: Number of engaged partners and
documented success stories).
Based on these priorities, the following next steps will be taken.
• Develop a three-year strategic plan based off the Needs Assessment with clear priorities and
detailed strategies that can be tracked over time.
• Develop action plans based off each of the identified strategies.
• Select two to three key performance indicators to track regularly to see if progress is being
made.
3
Quantitative Data
Analysis
4
Primary Wellbeing Predictors
Primary wellbeing indicators, or “root cause indicators” are those factors that drive and predict multiple
related outcomes in wellbeing. The primary root causes of poor outcomes for children are low income,
poverty, undereducation, and lack of opportunity to thrive. These factors are difficult to tease apart in a
“chicken or egg” manner, and typically most of these factors exist together, resulting in “deprivation
amplification”.
Income and Poverty
Insufficient income, such that wealth cannot be built and transmitted generation to generation, drives
poverty. Poverty is a multifaceted concept which may also include social, economic, and political
elements. At its most basic, poverty is the scarcity or lack of material possessions or money. However, full
understanding of poverty requires consideration of asset poverty, an economic and social condition that
is more persistent and prevalent than income poverty. Even when income is sufficient to get by, there is
frequently the inability to access and build wealth resources such as homeownership, savings, stocks, and
business assets. In this case, assets are unavailable to support basic needs in cases of emergency and are
unavailable to pass on to children for intergenerational wealth-building. Children, especially, are
vulnerable to the effects of poverty. Children who live in poverty often experience chronic, toxic stress
that disrupts the architecture of the developing brain, resulting in lifelong difficulties in learning, memory,
and self-regulation, and poor health outcomes in adulthood. Children in poverty are much more likely to
experience exposure to violence, chronic neglect, and the accumulated and synergistic burdens of
economic hardship, or “deprivation amplification”.
Income
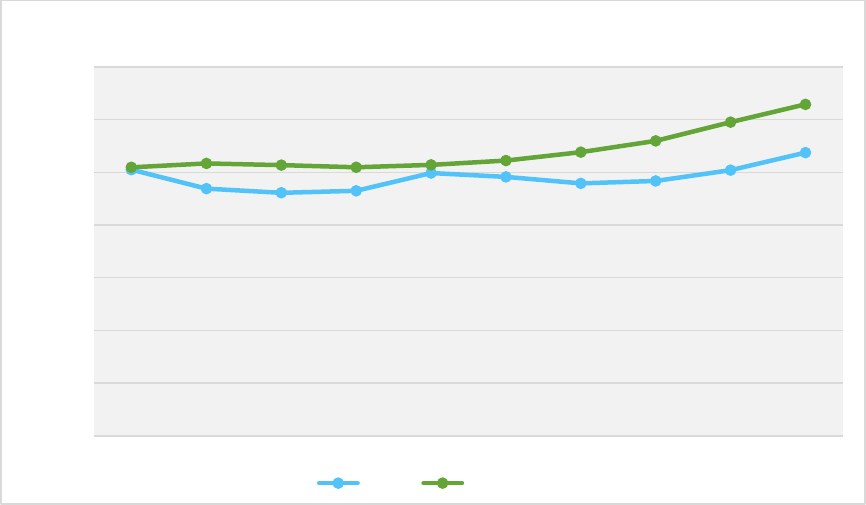
Median family income, that measure where half of the income falls above and half below, is a good
reflection of the average income in a place, since it controls for outlier data (very low or very high
incomes). The follow graph demonstrates that for families with children in Aiken County, median income
is persistently below the South Carolina average.
5
U.S. Census and Kids Count Data Center
Poverty Rates
Poverty rates can (and should) be examined at several levels: individual poverty, family poverty,
household poverty, child poverty, and levels of poverty. Poverty metrics should also be disaggregated by
race since Black and Hispanic residents have significantly higher poverty rates.
As of 2021, 21,943 residents of Aiken County (13.3% of the county population) live below Federal Poverty
Level (FPL), including 7,094 (19.8%) of the county’s children. Both of these rates are slightly below the
state averages of 14.5% for all residents and 20.8% for children.
Children in Poverty
In most geographies, poverty rates for children are higher than poverty rates for the general population.
In Aiken County, the poverty rate for children has been near the state average for the last five years.
$50,501
$46,903
$46,105
$46,470
$49,850
$49,106
$47,892
$48,345
$50,391
$53,736
$50,940
$51,681
$51,363
$50,967
$51,388
$52,241
$53,808
$55,975
$59,514
$62,898
$0
$10,000
$20,000
$30,000
$40,000
$50,000
$60,000
$70,000
2006-10 2007-11 2008-12 2009-13 2010-14 2011-15 2012-16 2013-17 2014-18 2015-19
Median Family Income for Families With Children
Aiken S.C. Average
6
Source: U.S. Census S1701
Children Living in Areas of Concentrated Poverty
Aggregated poverty data do not show how poverty is distributed across geographies. In the report The
Enduring Challenge of Concentrated Poverty in America,
1
the Federal Reserve and the Brookings
Institution studied communities where poverty is geographically concentrated at rates of 40% and above,
finding that concentrated poverty is nuanced from place to place, and that place matters. There are
common themes across all communities struggling with concentrated poverty: lack of human capital
development, high rates of unemployment, and inadequate housing.
A large middle class is one of the five predictors of communities with good social and economic mobility.
Large disparities in income, or income inequality, means that there is a small middle class in a given
community. When children live to adulthood in communities with income inequality, lifetime earnings
potential is low, and the cycle of poverty endures. Conversely, the literature shows that multiple benefits
derive from mixed income housing developments and income-diverse neighborhoods,
2
including safer
environments, access to more and improved services, good quality housing, and neighborhood amenities.
In addition, as low-income neighborhoods become more economically diverse, poverty is alleviated,
1
Federal Reserve and the Brookings Institution. “The Enduring Challenge of Concentrated Poverty in America:
Case Studies from Communities Across the U.S.” (2008). http://www.frbsf.org/cpreport/
2
https://www.urban.org/sites/default/files/publication/27116/412292-Effects-from-Living-in-Mixed-
Income-Communities-for-Low-Income-Families.PDF
30.3
28.3
26.6
25
22.1
20.1
19.8
26.3
25.3
24.5
23.7
22.2
21.2
20.8
0
5
10
15
20
25
30
35
2015 2016 2017 2018 2019 2020 2021
Percentage Children Under Age 18 Living Below FPL (5-year average estimates)
Aiken County S.C.
7
property values increase, and residents demonstrate an increased tolerance of diversity for neighbors of
all incomes.
To provide an accurate picture, these data must be disaggregated by race. The data reported in the
following graph, although variable likely due to small sample sizes, show that in Aiken County, Black and
Hispanic children are significantly more likely to live in areas of concentrated poverty, compared to White
children.
Source: Kids Count Data Center
Education
Education has multiple purposes but is always at the foundation of societies characterized by economic
wealth, social prosperity, and political stability. Education strengthens democracy by providing citizens
the tools that allow them to participate in the governance process. It is an integrative force to foster social
cohesion and supports critical thinking, skill development, and life-long knowledge acquisition. Moreover,
there is a direct correlation between education attainment and earnings, income, and wealth; the more
education an individual has (on average) the higher the income.
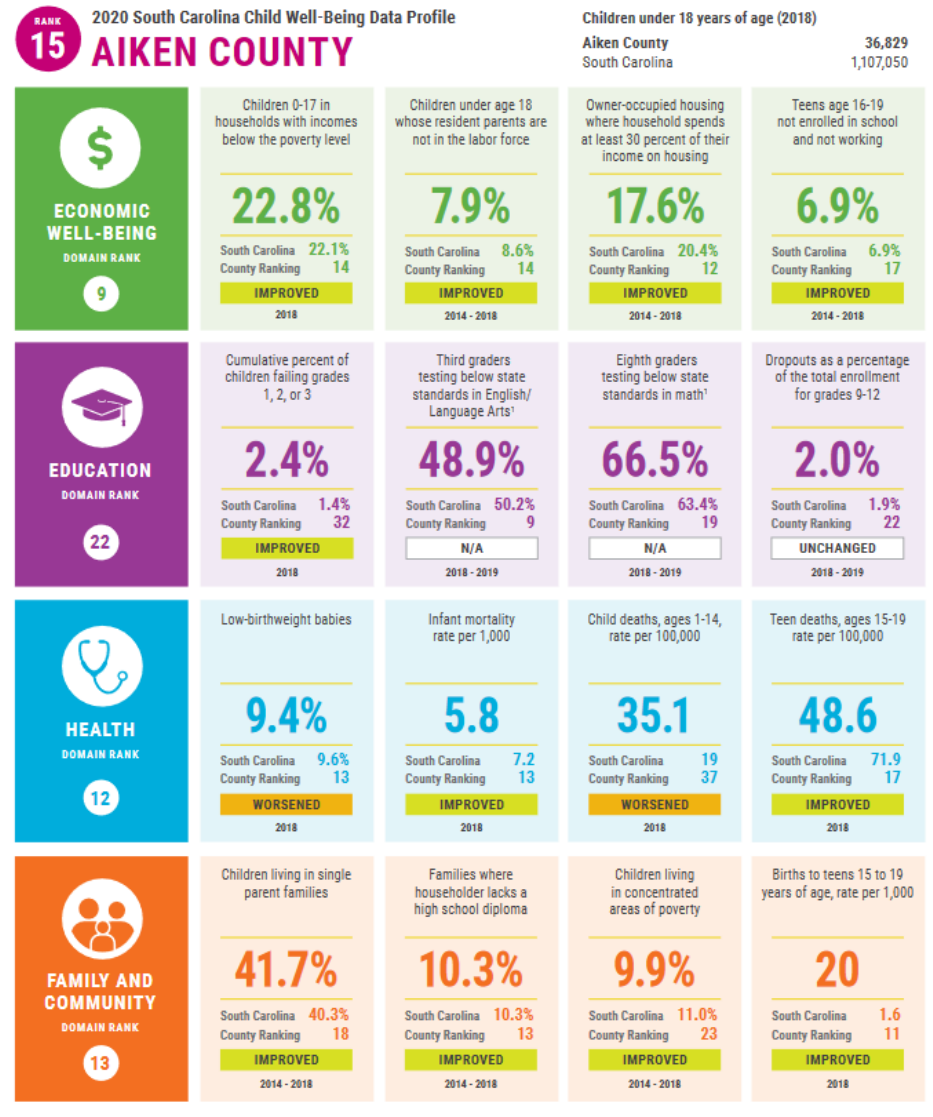
The Children’s Trust of South Carolina ranks Aiken County 22nd
3
among the state’s 46 counties for overall
education in 2020.
3
2020 South Carolina Child Well-Being Data Profile (scchildren.org)
24.8%
34.2%
39.2%
33.2%
28.7%
27.5%
9.5%
12.1%
8.2%
19.4%
18.5%
8.3%
7.8%
9.0%
4.2%
8.4%
8.5%
16.4%
41.7%
38.5%
24.9%
20.4%
26.0%
3.7%
15.9%
18.4%
0%
5%
10%
15%
20%
25%
30%
35%
40%
45%
2007-2011 2008-2012 2009-2013 2010-2014 2011-2015 2012-2016 2013-2017 2014-2018 2015-2019
Percent Children Living in Concentrated Poverty by Race, Aiken County, Trend
Black White Hispanic
8
Education Attainment
The future demands higher education attainment of the local workforce if our cities and counties are to
be economically competitive. Obtaining a post-secondary credential of some kind is critical to opportunity
and positive life outcomes. Residents of Aiken County have approximately the same higher education
attainment at the post-secondary level.
Source: U.S. Census S1501
Daycares
According to SC Department of Social Services, there are 57 licensed or registered childcare facilities in
Aiken County. These include licensed and approved childcare centers, registered faith-based centers,
licensed group childcare homes, licensed or registered family childcare homes. The total capacity of these
centers is 5,810 children.
12.6
12.9
32.2
29.5
20.7
20.6
8
9.6
16.9
17.4
9.5
10
0
10
20
30
40
50
60
70
80
90
100
Aiken County S.C.
Percent Residents Age 25+ by Level of Education, 2021 (5-year averages)
Less than H.S. H.S. Only Some College Associate Degree Bachelor Degree Graduate Degree
9
Source: US Census DP05
School Readiness
School readiness is a comprehensive connection between children’s readiness for school, families’
readiness to support their children’s learning, and schools’ readiness for children. Children are ready for
school when they possess the skills, knowledge, and attitudes necessary for success as they enter school
and for later learning. This requires age-appropriate physical, cognitive, social, and emotional
development.
Children's School Readiness is affected by the early care and learning experiences they receive. Research
in brain development emphasizes that early learning (especially from birth to five) directly influences a
child's ability to succeed in school. These studies have contributed to a growing awareness of the
importance of quality early education, pre-kindergarten, and K-4 experiences as predictors of school
readiness. Communities do well when they ensure that children have widespread access to these
programs, and especially programs like Head Start, targeted to children most at risk. Children's readiness
for successful transition into kindergarten is best viewed as a community responsibility.
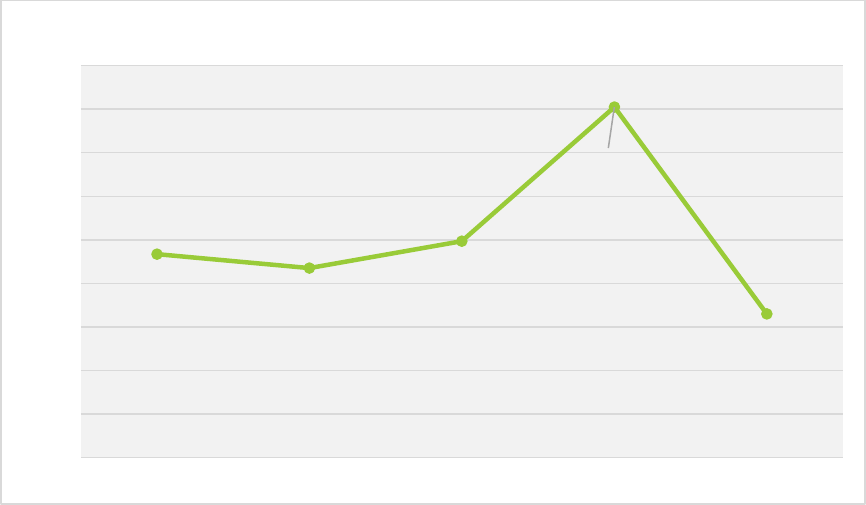
Compared to the state average, Aiken County Public Schools falls below the state average for overall
readiness to learn in terms of foundational skills and behaviors that prepare students for instruction.
However, on one sub-domain of this measure – physical wellbeing – Aiken County students perform
slightly better than the state average.
9,667
9,635
9,697
10,005
9,530
9,200
9,300
9,400
9,500
9,600
9,700
9,800
9,900
10,000
10,100
2017 2018 2019 2020 2021
Number of Residents under Age 5, Aiken County (5-year average estimates)

10
Percentage of Students enrolling in Kindergarten and Demonstrating Readiness to Learn,
2021-2022 by District
Overall
Language
and Literacy
Mathematics
Social
Foundation
Physical
Wellbeing
Aiken County Public Schools
35.5
23.6
23.4
50.5
51.9
S.C. Average
36.0
29.8
28.1
52.2
51.5
Source: SC DOE School Report Cards
Academic Achievement
South Carolina Department of Education monitors academic achievement across the spectrum of grades
and via a variety of instruments. The SC Ready assessments for English Language Arts (reading and writing)
and Mathematics are administered in grades 3,4,5,6,7, and 8. Academic performance in the elementary
years is predictive of ongoing achievement, graduation from high school, and enrollment in post-
secondary education.
Reading proficiently by the end of third grade is a crucial marker in a child's educational development.
Failure to read proficiently is linked to higher rates of school dropout, which suppresses individual earning
potential as well as the nation's competitive-ness and general productivity. Currently, 58.5% of Aiken
County third graders are below standards in reading. Generally, Aiken County students don’t fare as well
on this measure compared to the state average.
Percentage of 3
rd
Graders Testing Below Standards in English / Language Arts (on SC READY)
2015-2016
2016-2017
2017-2018
2018-2019
2020-2021
Aiken
58.7
58.7
59.5
48.9
58.5
S.C.
56.3
57.9
54.9
50.2
56.7
Source: Kids Count Data Center
Mathematical performance at the 8
th
grade is also a critical metric. If a child has received relevant
mathematics training and performed well by eighth grade, that child will have a higher likelihood of going
to college and will likely be more successful in high school, college, and careers beyond. Almost 75% of
Aiken County eighth grade students fall below standards in math, markedly above the state average. Aiken
County does not fare well on this metric over time, compared to the state average.
Percentage of 8th Graders Testing Below Standards in Math (on SC READY)
2015-2016
2016-2017
2017-2018
2018-2019
2020-2021
Aiken
79.0
74.0
70.3
66.5
74.9
S.C.
67.6
65.5
63.4
63.4
69.3
Source: Kids Count Data Center
11
These data and many other academic achievement data, disaggregated for each school district across the
state, can be found in the SC Department of Education School Report Cards.
On-Time Graduation
Students who graduate on time – earning a standard high school diploma in four years – are more likely
to continue their education at the post-secondary level. Historically, Aiken County School District has a
higher four-year graduation rate than the state average.
Source: SC DOE Report Cards
Generally, when time graduation rates are disaggregated by student demographic, Whites and non-
economically disadvantaged students graduate on-time at higher rates, compared to economically
disadvantaged, Black, and Hispanic students.
Drop out and Teen Idleness
The 2020 South Carolina Child Well-Being Data Profile, produced by the Children’s Trust of South
Carolina,
4
ranks Aiken County as 22
nd
of the state’s 46 counties for dropout (#1 is best). The latest data
4
2020 South Carolina Child Well-Being Data Profiles. https://scchildren.org/resources/kids-count-south-carolina/child-well-being-data-county-
profiles/
91.3
91.2
90.5
89.9
81.1
82.2
83.3
83.8
0
10
20
30
40
50
60
70
80
90
100
2019 2020 2021 2022
Percent Students Graduating Within Four Years
Aiken S.C.

12
show that there were 2% dropouts of the total enrollment for grades 9-12 in Aiken County in 2018-2019.
The state average is 1.9%.
Because capturing dropouts is often difficult at the school and district levels, the U.S. Census offers two
alternate measures: percent teens not enrolled in school and not a high school graduate, and an “idleness”
measure for teenagers – residents ages 16-19 who are not enrolled in school and not working. These may
be a more accurate measure of dropout. Because numbers are small, especially in rural counties, 5-year
rolling averages are used for this measure.
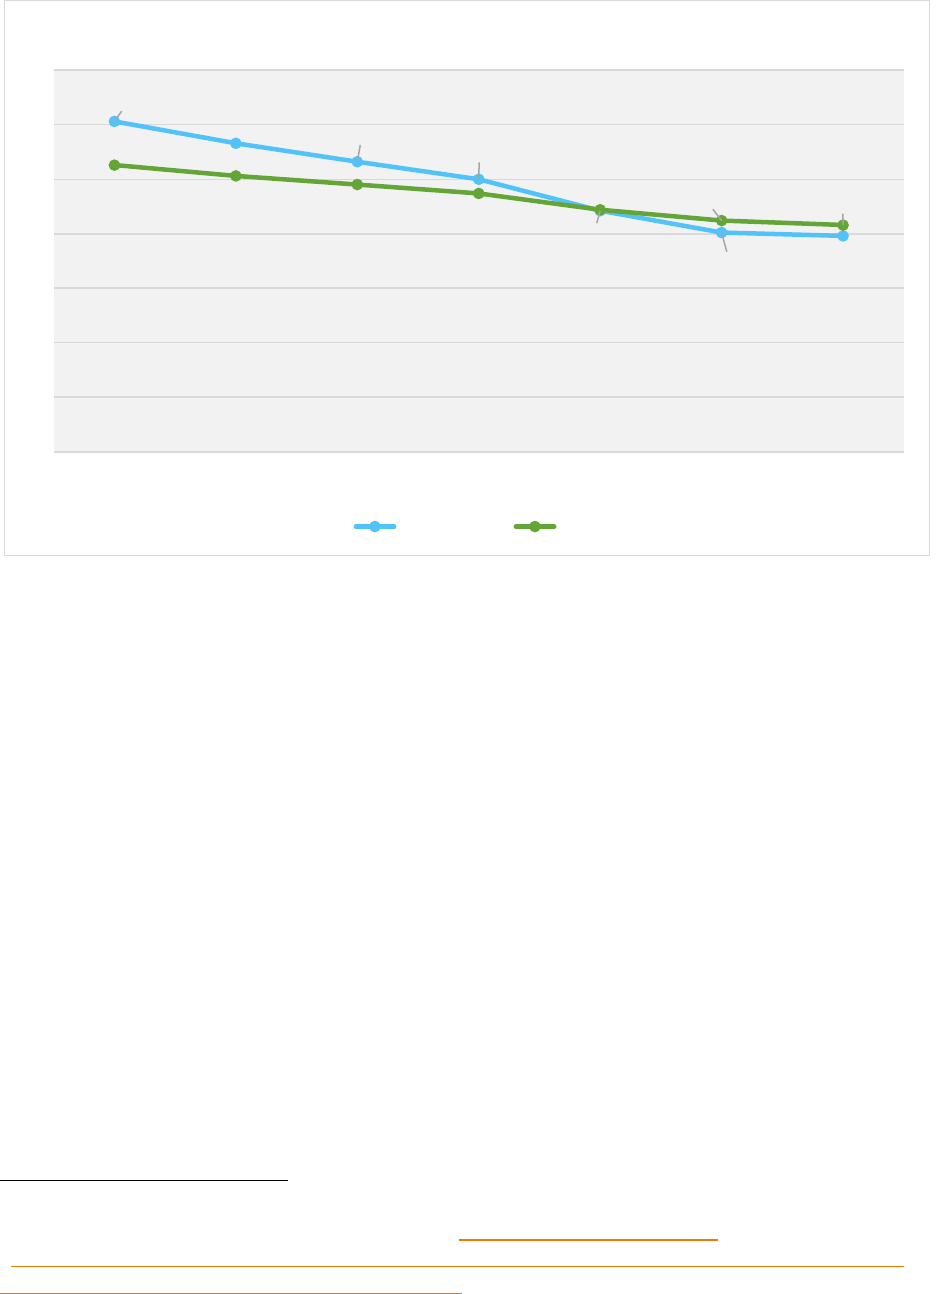
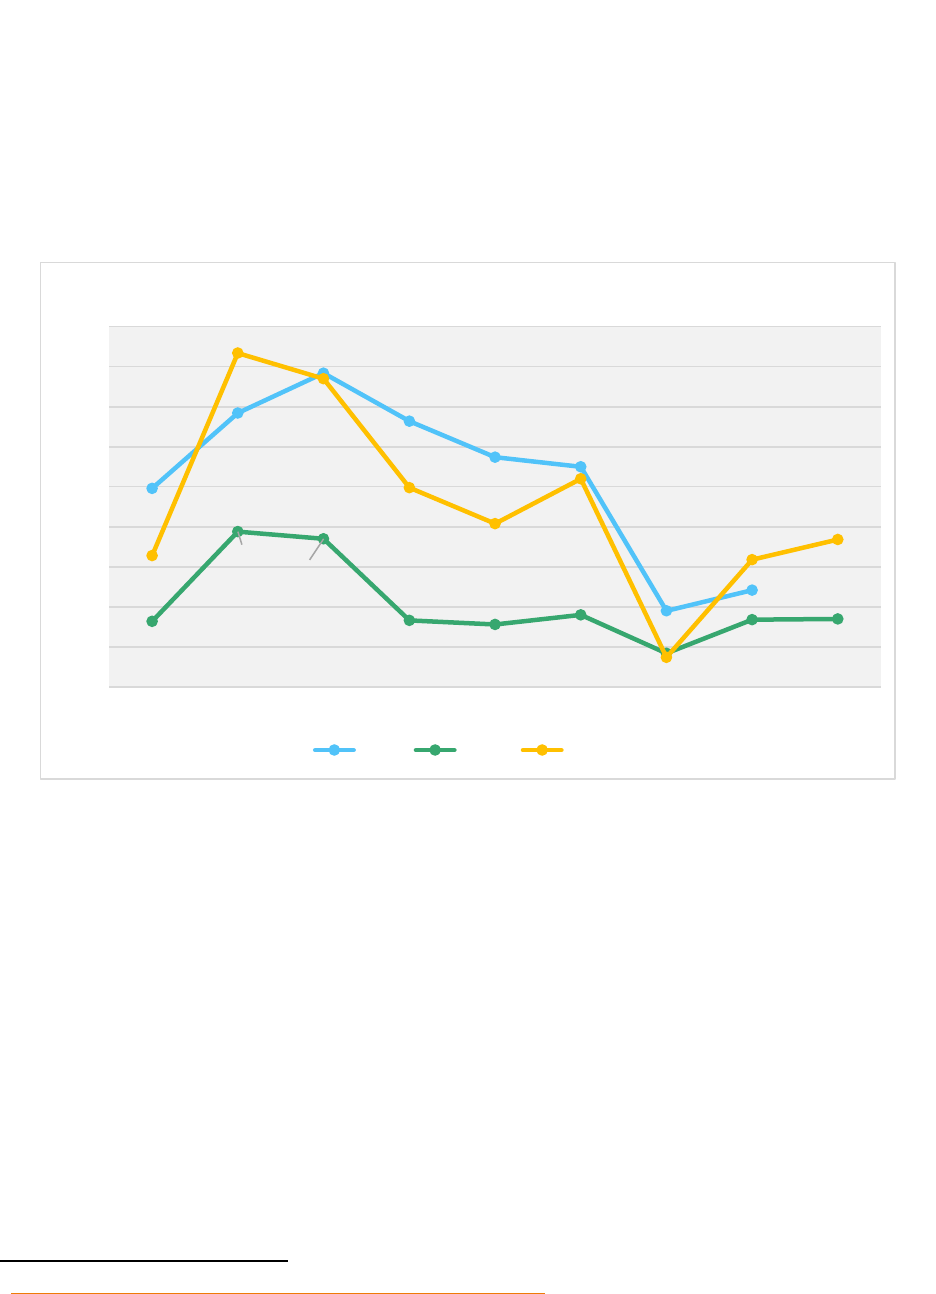
The percentage of teens who are not enrolled in school and not high school has improved in Aiken County
and now essentially equates to the state average.
Percent Teens age 16-19 Not Enrolled in School and Not a High School Graduate
2007-
2011
2008-
2012
2009-
2013
2010-
2014
2011-
2015
2012-
2016
2013-
2017
2014-
2018
2015-
2019
Aiken
7.3
7.5
10.0
6.6
5.9
5.1
5.0
3.0
3.8
S.C.
6.8
6.0
5.8
5.4
5.0
4.4
4.1
3.9
4.0
Source: Kids Count Data Center
The percentage of “idle” teens in Aiken County shows a similar improving trend and is also currently at
the state average.
Percent Teens age 16-19 Not Attending School and Not Working
2007-2011
2008-2012
2009-2013
2010-2014
2011-2015
2012-2016
2013-2017
2014-2018
2015-2019
Aiken
9.5
10.9
13.3
10.8
10.5
10.1
8.7
6.9
6.8
S.C.
9.1
9.1
9.3
8.7
8.5
7.8
7.1
6.9
6.9
Source: Kids Count Data Center
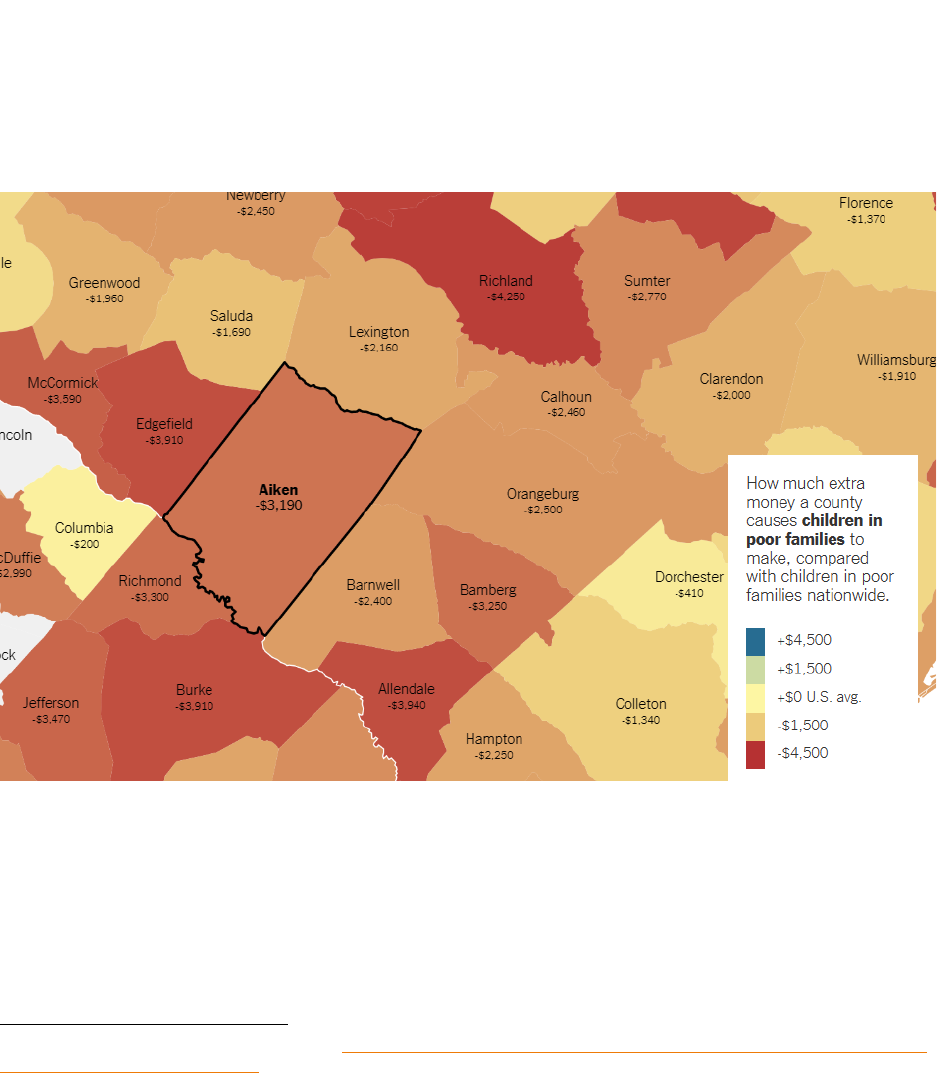
Opportunity
Where a child grows up in the US has a major impact on his or her financial future. Economic mobility has
significant relevance for communities of color since they tend to have the lowest income and fewest
opportunities to move up on the economic ladder. In their recent Equality of Opportunity Project
18
, three
Harvard economists used “big data” to map upward mobility across the country. The results showed wide
variation among the nation's cities and counties in intergenerational mobility, leading the researchers to
conclude that some areas provide significantly more opportunity for children to move out of poverty, and
other areas offer children few opportunities for escape. Where children are raised has a significant impact
on their chances of moving up economically. The research found that communities with high levels of
upward mobility tend to have five characteristics:
13
• lower levels of residential segregation by race
• a larger middle class (lower levels of income inequality)
• stronger families and more two-parent households
• greater social capital
• higher quality public schools
The latest calculations and comparisons of the 2,478 counties in the U.S. show that South Carolina
counties rank among the lowest in the country for chances of upward mobility for poor children. Aiken
County is considered to be “extremely bad” in helping poor children up the income ladder. Aiken County
ranks 123
rd
worst out of 2,478 U.S. counties, better than about only 5% of counties for opportunity for
poor children to break out of poverty.
If a child in a poor family were to grow up in Aiken County, instead of an average place, he or she would
make $3,190 (or 12%) less at age 26.
Source: The Upshot
5
5
The Upshot. The best and worst places to grow up. https://www.nytimes.com/interactive/2015/05/03/upshot/the-best-and-worst-places-to-
grow-up-how-your-area-compares.html
14
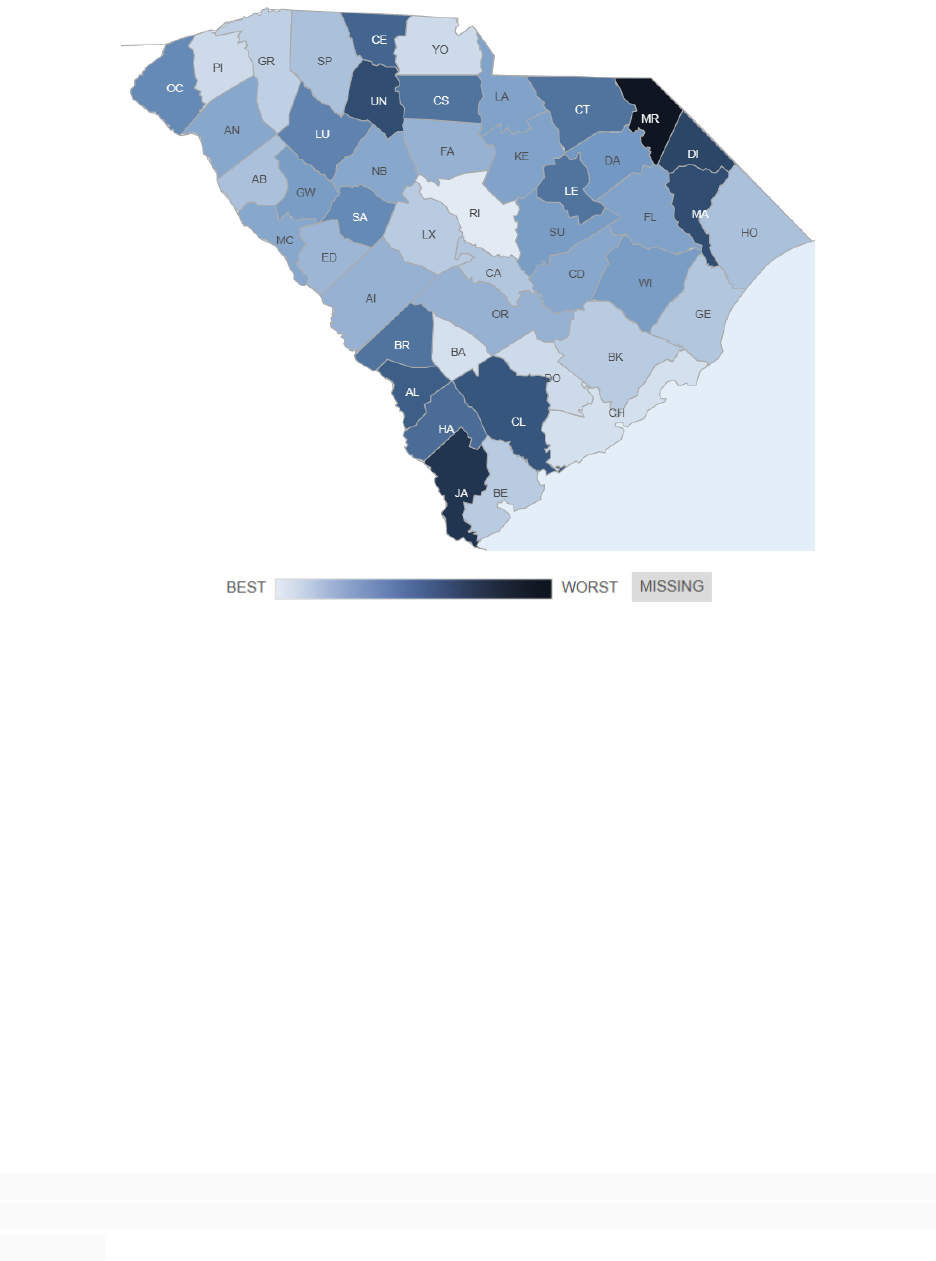
Overall Wellbeing
For overall wellbeing for children, Aiken County ranks 15
th
best of the state’s 46 counties.
Source: Children’s trust of SC
15
Other Wellbeing Indicators
Overall Health
Where health-promoting factors do not exist, the cost to the community is high. Social and economic
factors are the strongest determinants of health outcomes. If people do not have access to safe places to
live and be active, to healthy food, to clean air and water, and to preventive care and treatment, they will
not be healthy. When community conditions are not health-promoting, there is a lower quality of life for
everyone.
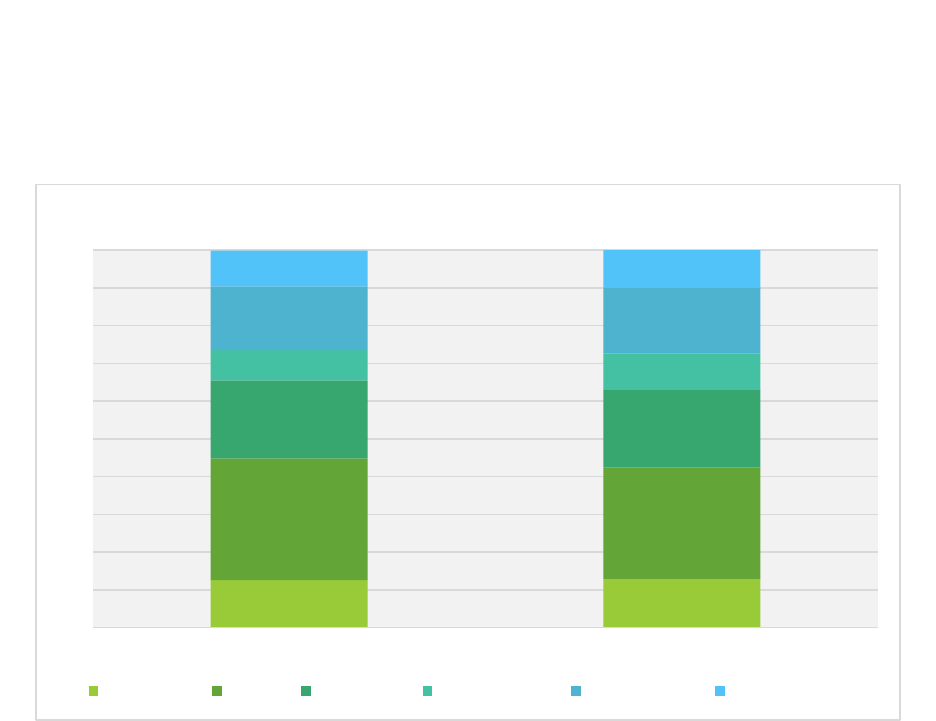
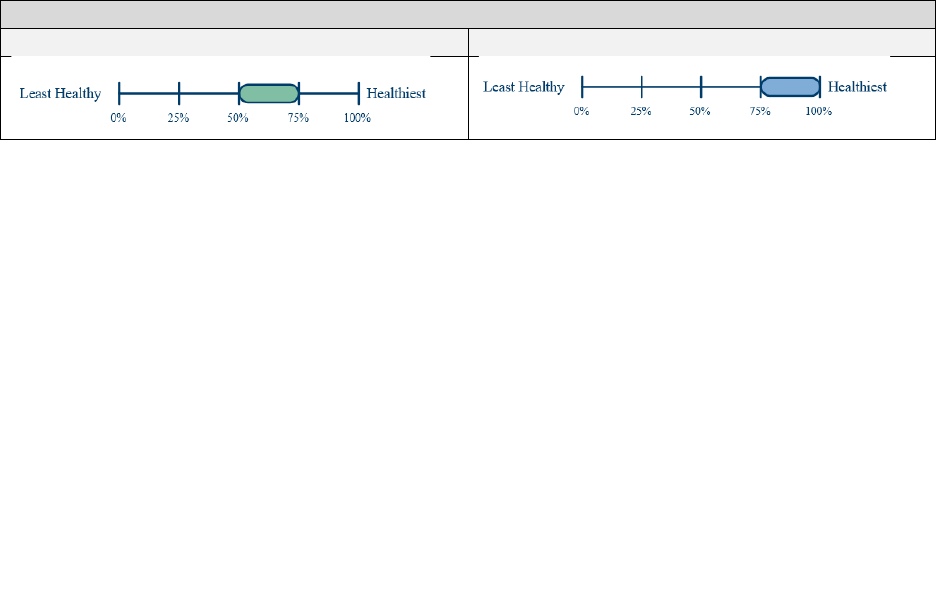
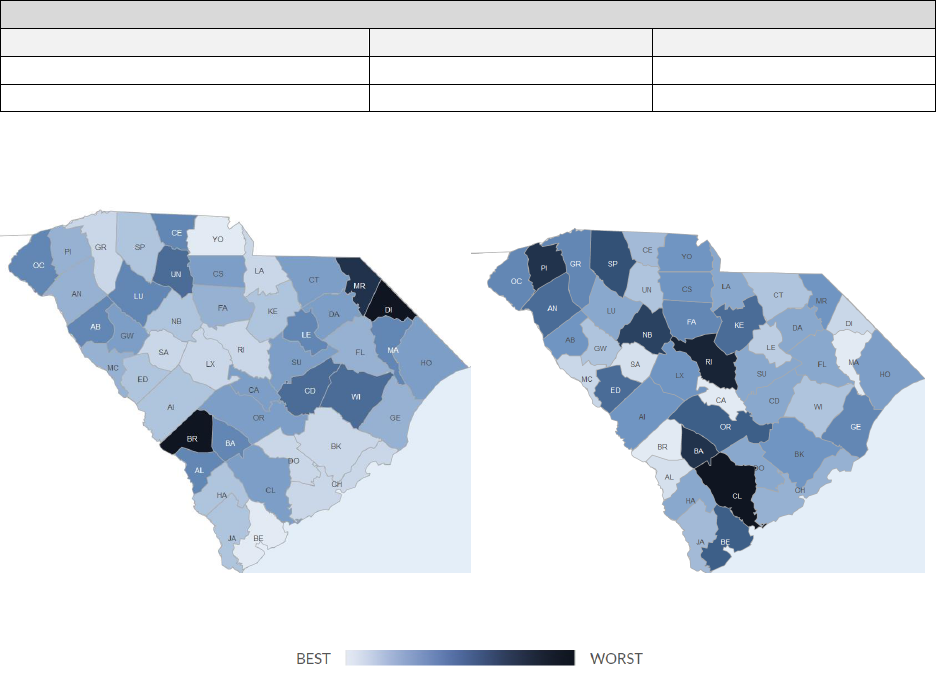
Aiken County is ranked in the higher middle range of counties in South Carolina for health outcomes.
These outcomes include length of life / premature death and various quality of life measures. Aiken
County is ranked among the healthiest counties in South Carolina for health factors. These factors include
various health behaviors, clinical care factors, social and economic factors, and measures of the physical
environment.
Within-State Overall Health Ranking, Aiken County (2022)
Health Outcomes
Health factors
Source: County Health Rankings and Roadmaps
Infant Mortality
Infant mortality is a good measure of population health since it reflects the economic and social conditions
that impact health in a community. The United States has the highest maternal and infant mortality rates
among comparable developed countries. The current (2022) infant mortality rate in the United States is
5.547 deaths per 1,000 live births. South Carolina is among the states in the US with the highest infant
mortality rates, 6.64 per 1,000 live births in 2020, constituting 370 infant deaths in that year.
Because numbers of child deaths within the first year of life are relatively low, especially for sparsely
populated geographies, multiple year averages are often used to measure infant mortality. For the
combined 2017-2019 period, 49 babies died in their first year of life in Aiken County, equating to an infant
mortality rate of 8.8 per 1,000 live births, higher than the state average rate.
It should be noted that there is a significant racial inequity in this measure. Black infants in the U.S. are
more than twice as likely to die as White infants – 10.8 per 1,000 Black babies, compared to 4.6 per 1,000
White babies. This racial inequity is wider than in 1850 and in one year constitutes 4,000 inequitable
deaths of Black babies. Education and income do not mitigate this inequity – a Black woman with an
advanced degree is more likely to lose her baby in its first year of life than a White woman with less than

16
an eighth-grade education. Disaggregated trend data for infant mortality in Aiken County and the state
averages can be found in the following table. In most cases, infant mortality is more than twice as high for
Black babies compared to White babies.
Infant Mortality Rate, * by Race (combined year averages)
2012-2014
2013-2015
2014-2016
2015-2017
2016-2018
2017-2019
Aiken
County
Total
7.0
5.7
5.6
7.7
8.2
8.8
White
5.7
4.5
4.1
5.7
6.6
6.4
Black
9.8
7.2
8.7
11.4
11.1
13.3
S.C.
Total
7.0
6.8
6.8
6.8
6.9
6.8
White
5.0
4.9
4.9
5.0
5.0
4.7
Black
10.7
10.9
10.6
10.5
10.6
11.0
*per 1,000 live births
Source: SC DHEC and Kids Count Data Center
Teen Childbearing
Births to teens have substantial implications for educational and socioeconomic outcomes for the teen
mother. Parenthood is the leading reason that teen girls drop out of school. More than 50% of teen
mothers never graduate from high school, whereas approximately 90% of teen who do not give birth will
graduate from high school. Additionally, less than 2% of teen moms earn a college degree by age 30.
Because many teen mothers live in poverty, care for both mother and child can be publicly funded for
years, including assistance programs for food, medical care and childcare. In addition, daughters of teen
mothers are more likely to become teen mothers themselves, creating cyclical poverty over generations.
6
For the combined years 2014-2020, there were 26 teen births per 1,000 females in Aiken County age 15-
19. Disaggregated by race, this equates to a rate of 29 for Black teens, a rate of 36 for Hispanic teens, and
a rate of 23 for White teens. Aiken County has a higher rate of overall teen childbearing than the state
average of 23 per 1,000 and the national average of 19 per 1,000.
6
Fact Forward: https://www.factforward.org/news/high-costs-teen-pregnancy
17
Teen childbearing has decreased substantially in South Carolina, mirroring the national trend.
Health Insurance
Health insurance coverage is a strong indicator of access to health care (as is provider availability) and the
likelihood of receiving quality care. Rates of health insurance coverage in a community speak not only to
the health status of that community, but also to the economic status of the community and the
distribution of well-paying jobs. Further, when health insurance coverage is low, costs to society are often
high since the uninsured frequently seek treatment in emergency departments for non-emergent
conditions and often do not get timely treatment for chronic illnesses, resulting in higher costs and lost
worker productivity.
In Aiken County, 4.1% of the residents under age 19 are uninsured (neither public or private insurance) in
2021. This equates to 1,579 children and youth.
Child Maltreatment
Child maltreatment is abuse and neglect that occurs to children under 18 years of age. It includes all types
of physical, emotional, and sexual abuse in addition to all forms of neglect, negligence, and exploitation
of children. It is difficult to obtain valid and reliable comparative statistics on child abuse and neglect even
though it cuts across all communities in South Carolina. The data reported in the following table are
18
offered as static information without inference. These are founded investigations; that is, the
determination following an investigation by a child protection worker is that, based on available
information, it is more likely than not that child abuse or neglect did occur. These investigations are not
“unique”; that is, they may include multiple investigations for the same children.
Total Number of founded Investigations for Child Abuse and Neglect by SC Fiscal Year
2011
2012
2013
2014
2015
2016
2017
2018
2019
2020
Aiken
194
169
174
232
248
258
267
393
387
298
Source: Kids Count Data Center
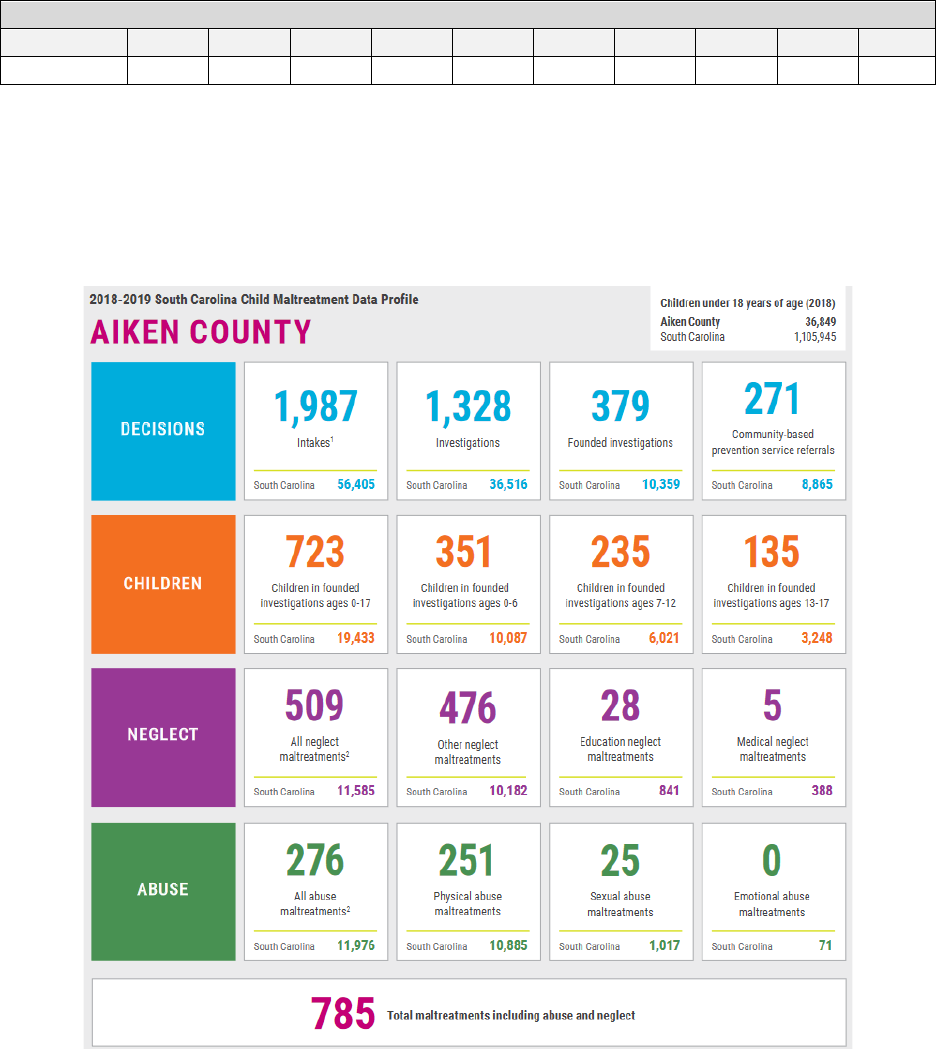
For more detailed 2018-2019 data regarding child maltreatment in Aiken County, see the following
tables, provided by the Children’s Trust of South Carolina, for each county.
Source: Children’s Trust of South Carolina

19
Adverse Childhood Experiences
Adverse childhood experiences (ACEs) are traumatic events that occur in a child’s life prior to the age of
18. Researchers have recently discovered a dangerous biological syndrome caused by abuse and neglect
and other ACEs during childhood. The toxic stress that characterizes childhood adversity can trigger
hormones that cause damage to the brains and bodies of children, putting them at a greater risk as adults
for disease, homelessness, incarceration, and early death. Further, childhood adversity often harms a
child’s brain and its development, which can result in long-term negative health and social outcomes. The
latest data show
7
that 62% of South Carolina adults report having experienced at least one ACE, and also
62% of Aiken County adults also report having experienced at least one ACE. The primary ACEs for Aiken
County are:
• Parental divorce / separation – 32%
• Household substance abuse – 31%
• Emotional abuse – 30%
Children of Color experience higher rates of ACEs. In South Carolina, 59% of White children have
experienced at least one ACE, while 65% of Black children and 67% of Hispanic children have experienced
at least one ACE.
Affordable Housing
According to the U.S. Department of Housing and Urban Development (HUD), the generally accepted
definition of affordable housing is that for which the occupants are paying no more than 30% of gross
income for housing costs, including utilities. In South Carolina, almost 20% of residents are not in
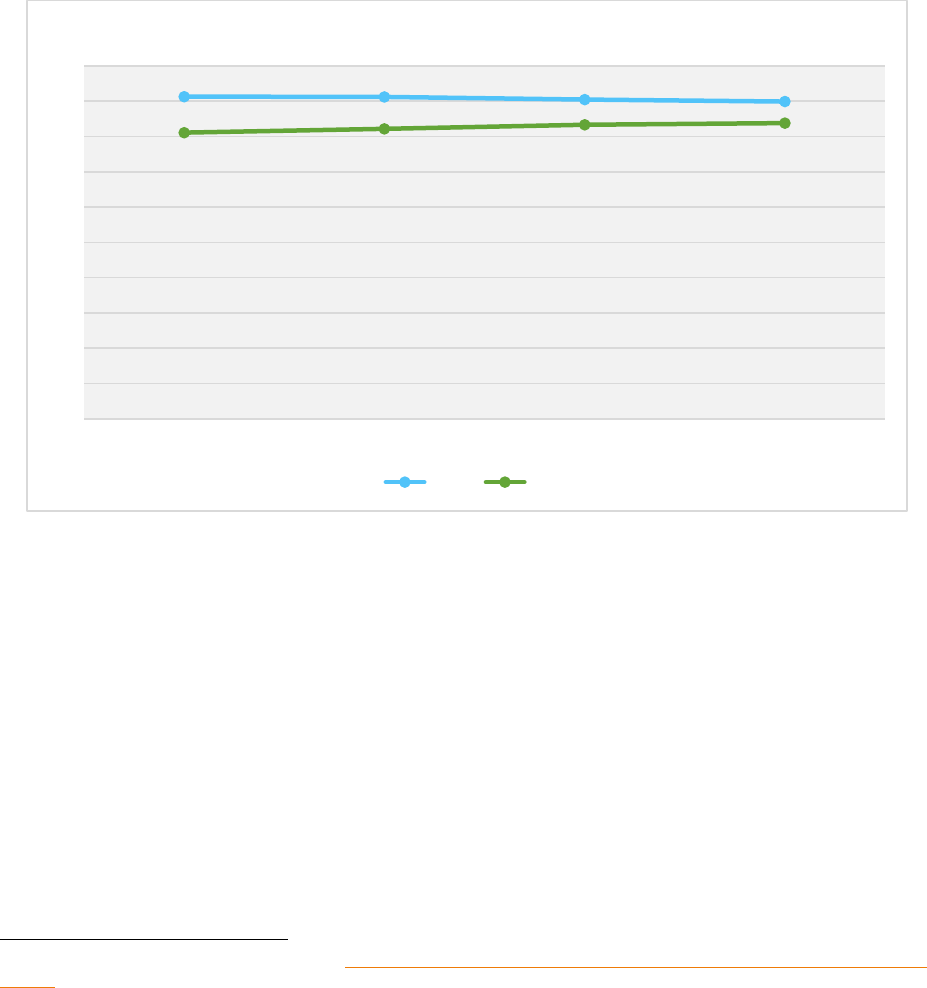
affordable housing situations, spending 30% or more of their income on housing costs. Aiken County
residents fare better than the state average at 16.5% not in affordable housing situations, and the trend
suggests that housing affordability is improving in Aiken County, mirroring the state trend.
Percent of Housing Units Where Householders Spend at Least 30% of Income on Housing
2007-11
2008-12
2009-13
2010-14
2011-15
2012-16
2013-17
2014-18
2015-19
Aiken
21.6
20.7
20.4
19.6
19.4
19.0
18.7
17.6
16.5
S.C.
25.5
25.1
24.8
24.2
23.1
21.9
21.1
20.4
19.6
Source: Kids Count Data Center
Food Environment
There are two basic measures that comprise the Food Environment measure:
• Limited access to healthy foods: the percentage of the population that is low income and does
not live close to a grocery store.
• Food insecurity: the percentage of the population that did not have access to a reliable source
of food during the past year.
7
Children’s Trust of South Carolina https://scchildren.org/resources/adverse-childhood-experiences/ace-data-county-profiles/
20
Although the data are not disaggregated by race, low- income people and People of Color are generally
the most at-risk populations for food insecurity and limited access to healthy foods. Compared to the
South Carolina averages, Aiken County fares slightly better on both food insecurity and access to healthy
foods.
Food Environment, 2019
Aiken County
S.C.
Food insecurity:
10%
11%
Limited access to healthy foods
9%
10%
Food Insecurity Map Limited Food Access Map
21
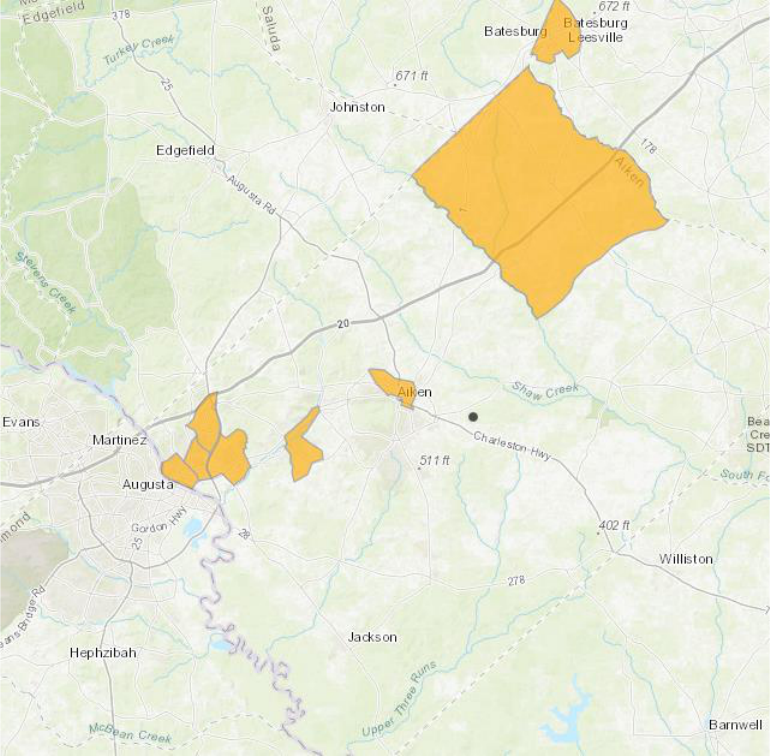
Food Deserts
Certain communities, particularly lower-income or minority communities, often lack supermarkets or
other sources of healthy and affordable foods. Food deserts, a component measure of food insecurity, is
defined as at least 500 people and / or at least 33% of a census tract’s population residing more than a
mile from a supermarket or large grocery store (more than 10 miles for rural census tracts). The following
map show portions of Aiken County, in orange, that are classified as food deserts.
Source: SC DHEC
22
Qualitative Data
Analysis

23
Focus Group Report
Executive Summary
On Monday, January 30, 2023, ISI Consulting hosted a focus group from 11:30 AM to 12:30 PM at the
Freeman Learning Center in partnership with Aiken County First Steps. Elizabeth Carpenter of ISI
Consulting met with parents currently participating in a First Steps program to ascertain their thoughts
and opinions on the work of Aiken County First Steps as well as to identify windows of opportunity for
improvements to early childhood development in Aiken County. A total of eight mothers and two Aiken
County First Steps employees participated in the focus group voluntarily. The eight mothers were paid
$30.00 cash per person for their time.
The major findings from this focus group were as follows:
Quality daycares are inaccessible.
All focus group participants agreed that they had problems finding quality childcare in Aiken County.
“They’re horrible,” remarked one participant. Another said, “I’m going to say they are babysitting. At the
end of the day, don’t put development on the sign, if that is not what you are working on with my child.”
One mother disagreed with those sentiments, stating she had found a childcare care facility that she and
her child loved; however she further informed the group that she can only send her child to said childcare
program for three half-days a week due the cost. The focus group also found agreement that the good
childcare opportunities price out a lot of families with their cost, leaving subpar places to choose from
that have openings or accept ABC vouchers. The increased cost of living is making this problem worse for
some mothers who are noticing increasing prices to childcare. “Everybody is dealing with the increase in
gas, but no one is getting paid more. They have been saying they were going to raise the minimum wage
for a while now, but they haven’t,” shared on participant.
Members of the focus group with older children noted that this problem with childcare was not as bad
with their previous children. With mothers having gaps of two years to over 15 years between kids, these
moms identified the increased expectations of kindergarteners and staffing shortages as key problems
lowering the quality of daycare centers. Parents with larger gaps between children reported their younger
child being responsible for knowing more than their previous kids did by age five. This means it is more
important that the people working with children aged birth-to-five are trained to do so. The majority of
moms, regardless of children’s birth order, also reported staffing shortages at childcare facilities. They
believe this is due to the low salaries which further pushes away good candidates from these jobs. Thus,
Aiken County is left having understaffed daycares operated by underqualified and underpaid employees.
Aiken County needs more child-centric resources.
Participants of the focus group all reported wanting more resources in Aiken County for their children. As
one mother said, “We should not have to be driving to Augusta for everything.” When asked to rank the
resources of Aiken County, not a single participant ranked them above a two. Everyone said either a zero,
one, or two. This was due to the lack of things available or known about. The types of resources parents
were looking for varied, but all fell into either health or recreational services. While parents were mostly

24
happy with the pediatric services, other health services—such as Urgent Care—were found to be lacking.
Most of the conversation focused on recreational opportunities. “There is nothing for kids here,”
remarked one mother. Another said, “Aiken is good for retirement. As far as raising a family, I don’t know.”
Things like child-friendly parks, a children’s museum, summer camps, and after school programs were all
mentioned on a wish list for Aiken County.
Aiken County First Steps is doing a good job but can focus on outreach more.
None of the focus group participants had anything negative to say about Aiken County First Steps. As one
mother said, “I have to give it to them. They do a lot.” All the participants were extremely grateful for the
services they received from First Steps and appreciated the work it does for them and their children. When
prompted for any suggestions for improvements, several mothers said that First Steps could do more
outreach to families not currently enrolled in the program, or in the First Steps circle. In fact, several
mothers participating in the focus group were in First Steps when they were a child, and one participant
was a grandmother whose child received services from First Steps, and now that child’s child is coming up
through the program. Some of the mothers have noticed a generational connection to who receives
services from First Steps, and think more outreach can address that issue.

25
Key Informant Interviews Report
Executive Summary
ISI Consulting conducted three key informant interviews with content experts identified by Aiken County
First Steps. Key informants were selected for their knowledge of and proximity to early childhood
education or development within the county. The informants included people working with organizations
that directly have contact with children under the age of five within Aiken County. The participants were
interviewed over the phone to obtain their perspective as part of the Community Needs Assessment of
Aiken County and ranged from 25 to 45 minutes. Interviews were manually transcribed by the interviewer,
and all participants were informed that their name and other identifying information would not be
attached to anything they shared.
The major findings from these interviews were as follows:
The child’s environment is a key indicator of their wellbeing.
Each key informant had their own viewpoint of early childhood development, but all three interviewees
indicated the rates of adverse childhood experiences were high in Aiken County. “We have pretty
significant child abuse rates here,” one informant told ISI Consulting. That was not the only adverse
experience, decrease in family income, internal family violence and abuse, family instability, parents
changing jobs frequently, family mental and physical health, drug abuse in the family, homelessness, and
gang violence were all mentioned by informants as negative trends they are seeing impacting children
aged birth-to-five in Aiken County.
These experiences stick with the child. “You are seeing the role [these adverse childhood experiences]
play on the mental health of children and their cognitive development,” said an interviewee. According
to one informant, these problems were only worsened as a result of the pandemic. With “children in
general, and the mental health and stability of families, we are clearly seeing the toll that covid and
isolation has caused,” they said. This led all informants to the next major finding: Parents need resources
and services too in order to help the child.
Parents need resources and attention.
The informants all believed that the best way to reach children aged birth-to-five was to help the parents
as well. A lot of resources are directed to children, when their parents are the ones most responsible for
ensuring that the child has its needs met. One informant summarized it as:
“If you shift focus to the parents and can prepare the parents and make them better
prepared, it is going to transition to the kids. Maybe the focus is too much on the kids,
when we start to teach the parents and put a focused, concerted effort on the parents. It
is going to leech into how they prepare their children. There is too much focus on the
child and not enough on the parent raising the child.”
The informants shared varying reasons for why parents need to be the focus of services. Some parents
are unengaged, and leave child raising to the grandparents or technology, some parents are simply

26
uninformed and unprepared, while other parents have their own traumas that they are passing down to
their children. What is important to the informants is that parents receive the resources they need to
carry out their duties as parents to the best of their abilities. Most of the informants acknowledged this
would be difficult to do as it requires prevention efforts as opposed to reactive ones. This can cause
problems as “a neglectful family never sees themselves as neglectful,” and so are less likely to reach out
for help or accept services. However, the informants believe this is the best way moving forward to
address a root cause of early childhood development delays in Aiken County.
There needs to be more affordable housing opportunities.
Informants noted there are growing concerns around affordable housing in Aiken County. The increasing
rate of homelessness was brought up in conjunction with the housing problems. The key problems were
said to be the increase of rent prices paired with the lack of affordable housing units in the county. One
key informant summed it up as:
“Single parent families are especially struggling with housing. We have a housing shortage
in Aiken, and so many of the landlords over the last few months have asked people to
move out, so they can fix up the house. Then they are selling it rather than renting it out
again. So many people don’t have housing. Today was a day where someone [came] to
my office to look for housing. The housing authority has waiting lists… I see the housing
issue as something that is here to stay.”
As the informants pointed out, the child’s environment is important to their development, that includes
safe and stable housing to live in.
Aiken County First Steps is seen as a community convener.
When asked to describe what Aiken County First Steps does best, and where they should direct their
efforts over the next two years, the informants painted similar pictures. They believe First Steps is situated
to act as the community resource for early childhood development referrals and resource connections.
One informant described it as, “I thought [of Aiken County First Steps] as the convener. First Steps was
not supposed to be the provider of services. It was to be a convener of and a facilitator of services across
the early childhood piece.” One informant noted that this role will be very important in the coming years
within South Carolina:
“I am really concerned because DSS said as of January 2024, they will no longer refer
families for child abuse that do not qualify for an education. They won’t be referred
anywhere. For almost 10 years now there was a referral mechanism to see if those
families wanted to receive help. That is going away across the state in 2024. For that birth-
to-five population, they are even more hampered because there is no universal education
component [for detection and referrals.]”
Two of the informants shouted out Marcia Nash, the Executive Director of Aiken County First Steps, for
the work she has done so far with forming and building relationships within the community, and all three
informants look forward to see in what ways Aiken County First Steps can bring more players together in
Aiken County.

27
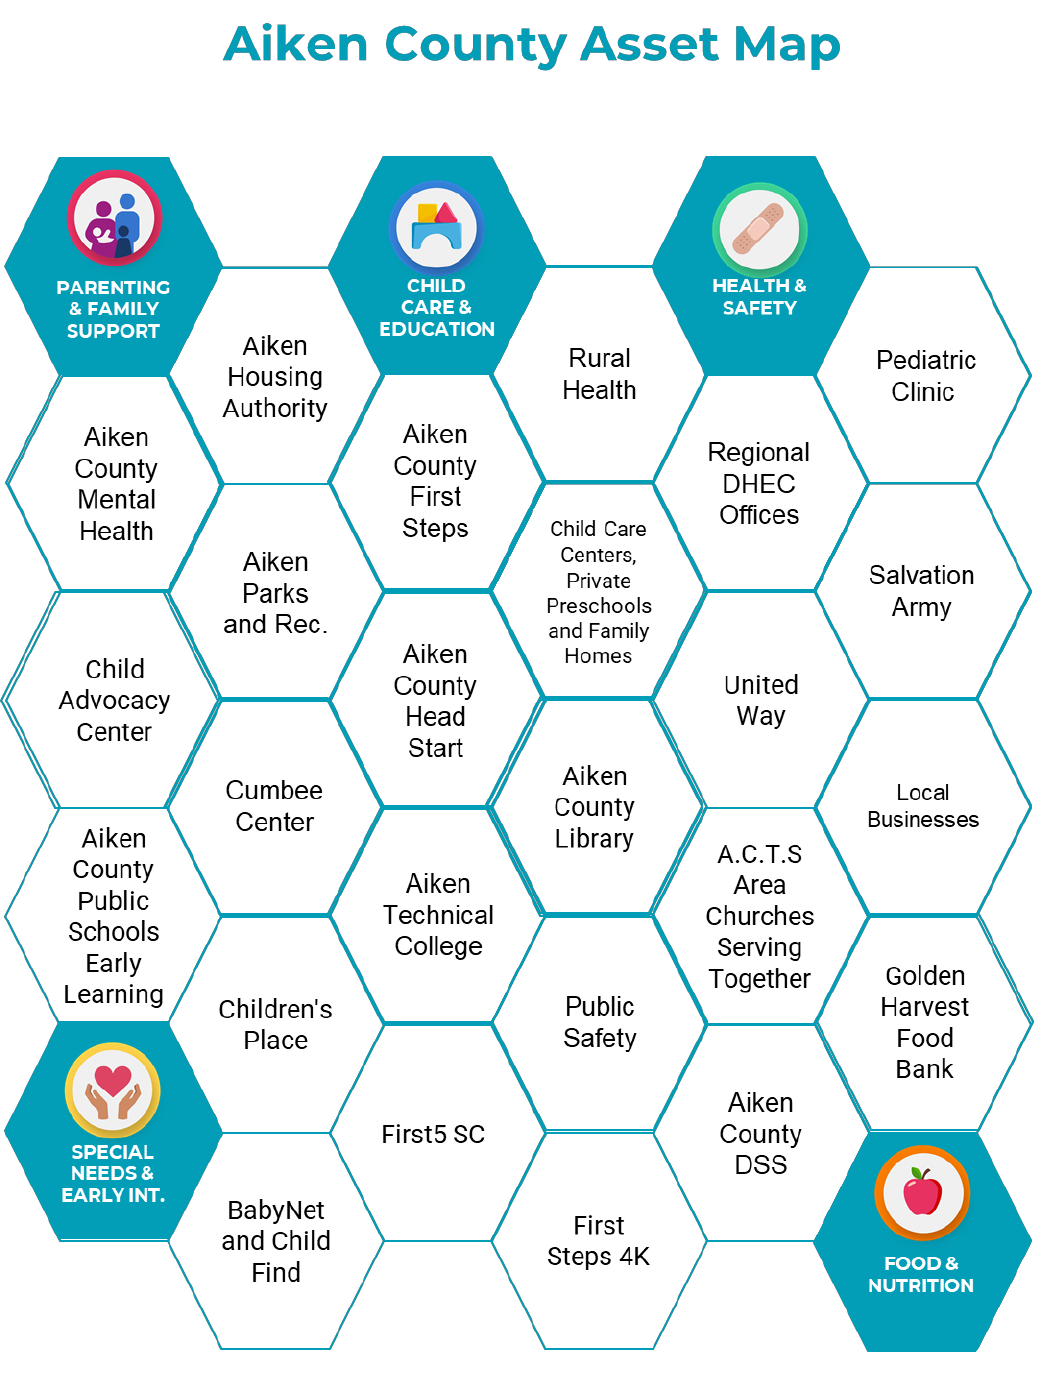
Community Engagement Session
After a formal presentation of the quantitative and qualitative data by ISI Consulting on February 21, 2023,
twenty-one (21) Aiken County First Steps team members and partners from the community discussed the
findings and its implications. Small groups were formed, and participants completed a worksheet to
identify gaps and areas of needed focus for the local First Steps. ISI Consulting facilitated the conversations
between the small group to reach shared agreement. From this conversation, priorities for Aiken County
and an Asset Map were created.
The priorities that emerged from this Needs Assessment include:
Increase outreach to focused areas and communities.
(Indicator: Number of individuals reached and type of outreach).
Participants discussed the need to reach out to focused areas and communities that need services from
Aiken County First Steps but currently not accessing their services. Focused efforts can be made with the
Hispanic population, families living in poverty, rural communities, and the Midland Valley area. Potential
strategies could be partnering with local churches and mobile outreach of services.
Increase capacity building of parents, grandparents and caregivers.
(Indicator: Number of classes and number of caregivers reached).
Capacity building can include but not be limited to: parenting classes, teaching basic care, literacy classes
and other topics. Participants believe that providing trainings and capacity building with the caregiver will
in turn support children and their educational outcomes.

28
Ensure quality and accessible childcare (interaction, supervision and health and
safety).
(Indicator: Assessment results from individual childcares, number of quality and accessible childcare
options and number of childcare vouchers.)
Some of the childcare workers taking care of children in Aiken County may or may not know how their
role is connected to the long-term outcomes of a child. Participants believe that providing training to
childcare workers and other strategies will increase the quality provided. A high-quality childcare is rated
by three variables, including: interaction, supervision and health and safety. In addition, more childcare
facilitates need to be accessible throughout the county.
Promote overall health and health screenings.
(Indicator: Number of engaged partners and documented success stories.)
Participants shared that access to care remains a top issue for families in Aiken County and the importance
of early health screenings. The importance of health screenings and preventative health measures can
also be integrated in the parent and caregiving capacity building workshops. The group believed that it
may be possible to partner with other organizations and advocate for more health screenings to take
place in the school setting due to accessibility and transportation challenges. In addition, participants
noted the importance of addressing food insecurity.

29
ABC
Vouchers
Aiken County
Childcare Centers,
Private Preschools,
and Family Homes
Aiken
County
Dentists
Aiken
County DSS
Aiken
County First
Steps
Aiken
County Head
Start
Aiken
County
Library
Aiken
County
Mental
Health
Aiken
County
Public
Schools Early
Learning
Aiken
County
Housing
Authority
Aiken Parks
and
Recreation
Aiken
Regional
Medical
Centers
Aiken
Technical
College
Area
Churches
Serving
Together
(A.C.T.S.)
Baby Net
Child
Advocacy
Center
Aiken County
Key Partners

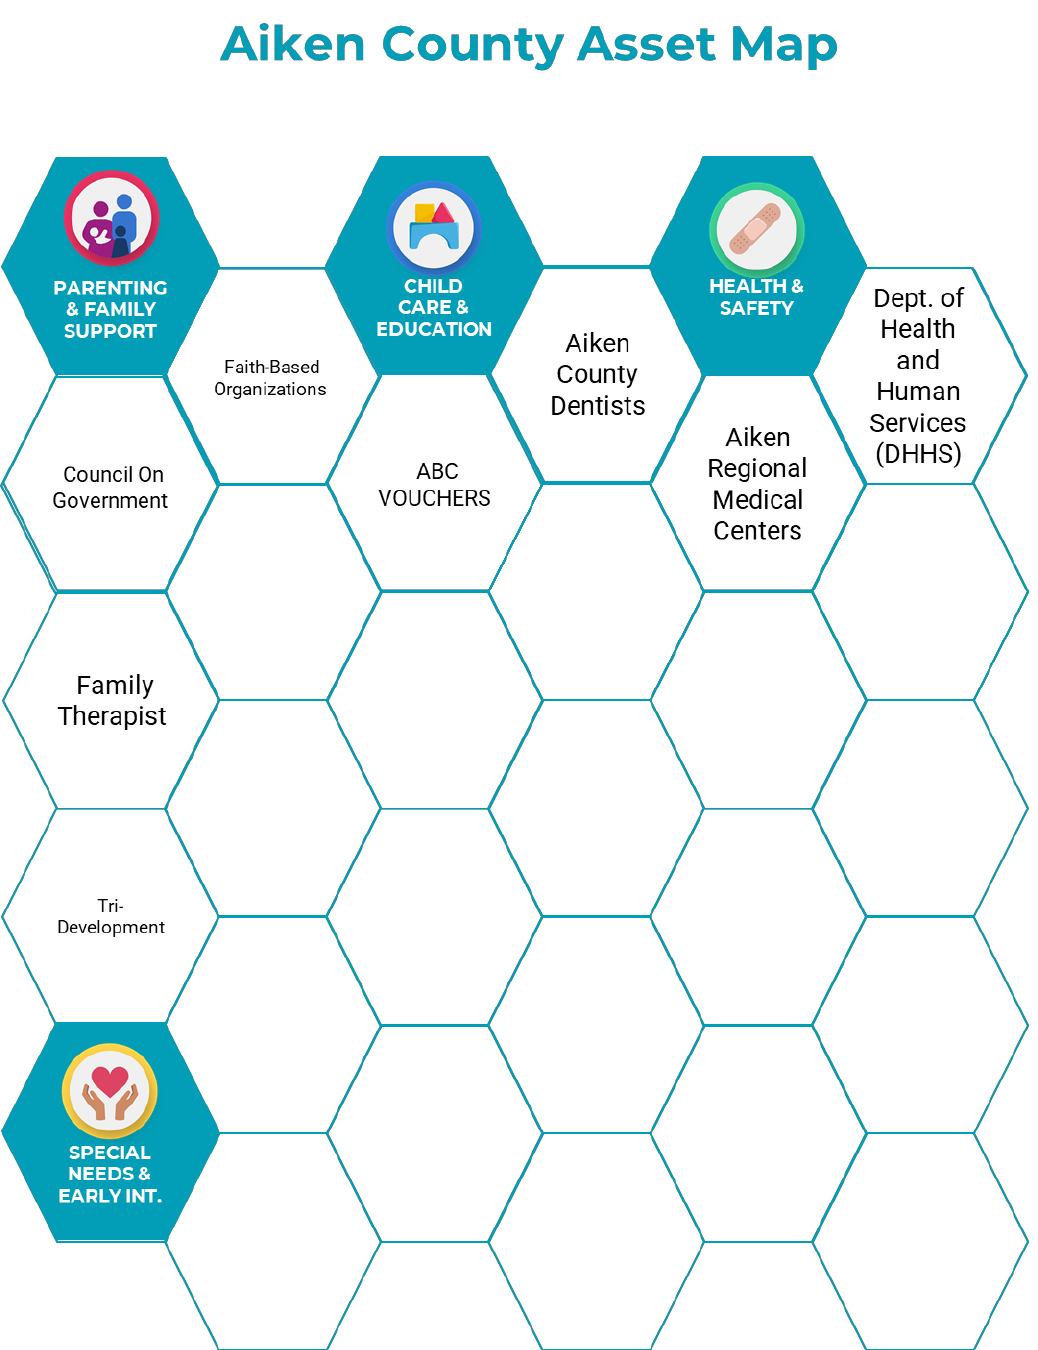
30
Aiken County
Key Partners
continued
Child Find
Children’s
Place
Council On
Government
Cumbee
Center
Faith-Based
Organizations
Family
Therapy
First 5 SC
First Steps
4K
Golden
Harvest Food
Bank
Local
Businesses
Pediatric
Clinics
Public Safety
Rural Health
Salvation
Army
Tri-
Development
United Way
Regional
DHEC Offices
Department
of Health
and Human
Services
(DHHS)
31
32
33
Kathleen Brady, PhD
Elizabeth Carpenter
Holly Hayes
Diana Kimmich
ISI Consulting
803.920.1736
sharpertogether.com
